You can export foot traffic density as well as data analytics from GeoPulse dashboard both single view port and split view port into a .csv file.
To use the export function
- Select grid(s)/polygon(s) to be exported.
- Click on the Export data icon.
- The system will automatically generate a .csv file based on selected grid(s)/polygon(s).
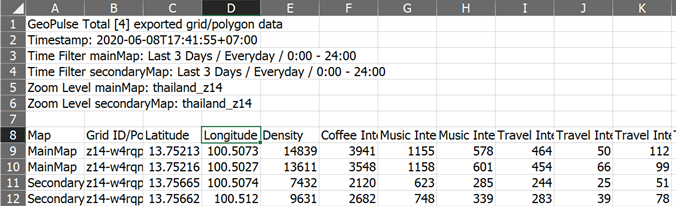
Example of the exported file
The exported file consists of 2 parts: header and detail columns. The header contains common information like timestamp, current selected filter, current zoom level while detail columns shows density, Latitude/Longitude, and analytical data of the selected grid(s) / polygon(s)